Weixin Service

 DouYin
 KuaiShou

Eye diagram test - electrical performance test
Date:2021-11-02 17:11:10 Views:11224
Eye diagram test is a test used to test the quality of signal. The eye diagram of digital signal contains rich information, which can reflect the overall characteristics of digital signal and evaluate the quality of digital signal. Therefore, the analysis of eye diagram is one of the keys of signal integrity analysis of digital system.
Eye pattern formation
In general, the eye diagram of the signal can be observed by an oscilloscope. The specific operation methods are: oscillate the oscilloscope across the output terminal of the receiving filter, then adjust the oscilloscope scanning cycle, so that the horizontal scanning period of the oscilloscope is synchronized with the period of the receiving symbol, and the graph seen on the oscillograph screen is called the eye diagram. Generally, the signal measured by the oscilloscope is the waveform of some bits or a certain period of time, which more reflects the detailed information, while the eye diagram reflects the overall characteristics of all digital signals transmitted on the link.
Eye diagram is actually the display of a series of different binary codes of digital signals accumulated on the oscilloscope screen according to a certain law. In short, because the oscilloscope has afterglow function, eye diagram is formed as long as all captured waveforms are superimposed and accumulated according to every three bits (as shown in the above figure).
测试-电性能测试_20211102163845_339.jpg "眼图(eye diagram)测试-电性能测试")
What is eye chart test?
Simply put, eye diagram is to superimpose a series of bit cycles on the horizontal axis of oscilloscope to form eye like waveform. Eye diagram is actually the display of a series of different binary codes of digital signals accumulated on the oscilloscope screen according to a certain law. Because the oscilloscope has afterglow function, eye diagram is formed as long as all captured waveforms are superimposed and accumulated according to every three bits.
Eye diagram test method
Eye diagram test is an important item of physical layer test of high-speed serial signal. The eye diagram is a graph superimposed by multiple bit waveforms. From the eye diagram, we can see: digital signal level 1 and 0, whether the signal has overshoot and ringing, whether the jitter is large, whether the signal-to-noise ratio and rise / fall time of the eye diagram are symmetrical (duty cycle). Eye diagram reflects the signal quality when there is a large amount of data, and can most intuitively describe the quality and performance of high-speed digital signal.
The traditional eye chart measurement method is understood in Chinese as 8 words: "synchronous trigger + superimposed display", and the modern eye chart measurement method is also understood in Chinese as 8 words: "synchronous cutting + superimposed display". The difference between the two methods is four words: trigger and cutting. The traditional method is to trigger and the modern method is to cut. "Synchronization" is the key to accurately measure eye diagram. The traditional method is different from the modern method. "Overlay display" is to continuously accumulate display by simulating afterglow. The traditional eye diagram method is to trigger once synchronously and then stack once. For each trigger, a UI is added to the eye diagram, and the data of each UI is arranged relative to the trigger point. For each trigger, only one bit is added to the eye diagram.
Relationship between eye diagram and performance
The open size of the "eyes" of the eye diagram reflects the strength of inter symbol crosstalk. The larger the "eye" and the more correct the eye diagram, the smaller the inter symbol crosstalk; Conversely, it means that the greater the inter symbol crosstalk. When there is noise, the noise will be superimposed on the signal, and the trace of the observed eye pattern will become blurred. If there is inter symbol crosstalk at the same time, the "eyes" will open smaller. Compared with the eye diagram without inter symbol crosstalk, the original clear and correct fine lines have become fuzzy striplines and are not very correct. The larger the noise, the wider the trace and the more blurred it is; The larger the inter symbol crosstalk is, the more incorrect the eye pattern is.
The following conclusions are obtained from theoretical analysis. In practical application, we should use this as a reference to discuss the system performance from the eye diagram:
(1) The best sampling time should be when the "eyes" open the most.
(2) The sensitivity to timing error can be determined by the slope of the oblique edge of the eye diagram. The larger the slope, the more sensitive it is to the timing error.
(3) At the sampling time, the vertical height of the shadow area of the upper and lower branches of the upper eye diagram indicates the maximum signal distortion.
(4) The horizontal axis position in the center of the eye diagram corresponds to the decision threshold level.
(5) At the sampling time, the distance between the upper and lower branches and the nearest trace to the threshold indicates the noise tolerance of each corresponding level. If the instantaneous noise value exceeds it, wrong decision may occur.
(6) For the receiving system which obtains timing information by averaging the signal zero crossing, the size of the area where the inclined branch of the eye diagram intersects the horizontal axis represents the variation range of the zero position, which has an important impact on the extraction of timing information.
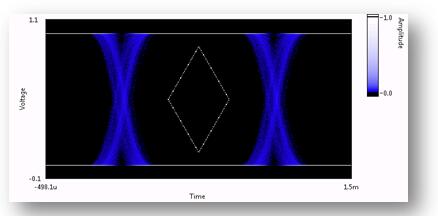
How to judge eye chart
In actual testing, in order to improve testing efficiency, the method often used is mask testing. That is, according to the demand of signal transmission, specify an area on the eye diagram (such as the diamond area in the figure), and all the left and right signals are required to appear outside this area. Once there is a signal in the diamond area, it will be declared that the test has not passed.